One powerful candlestick can reveal strong directional conviction. The structure of a KO Candle remains the same wherever it forms.
What Is a KO Candlestick?
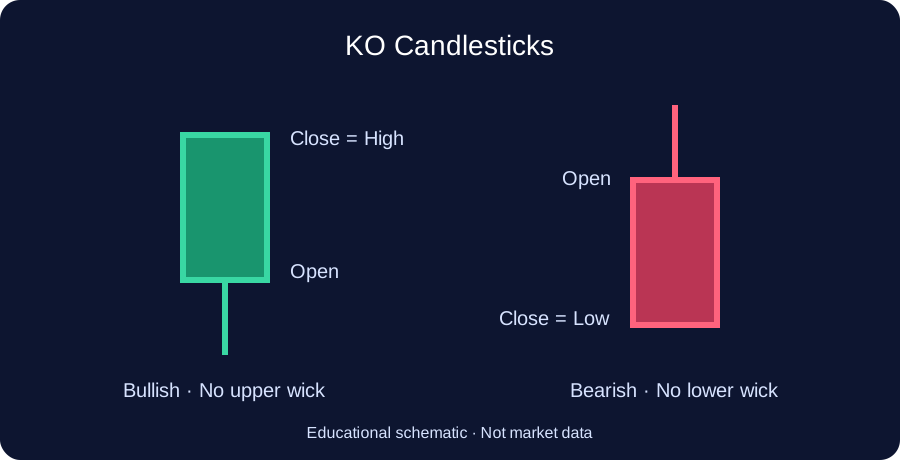
In the MACX Trading approach, a KO (Knockout) Candle is a high-momentum candlestick that shows strong buying or selling pressure into the close. It is based on the Closing Marubozu structure: price closes at the extreme of the candle.
The behavior of the KO candle itself stays consistent no matter where it appears on the chart.
1. Bullish Closing KO Candle
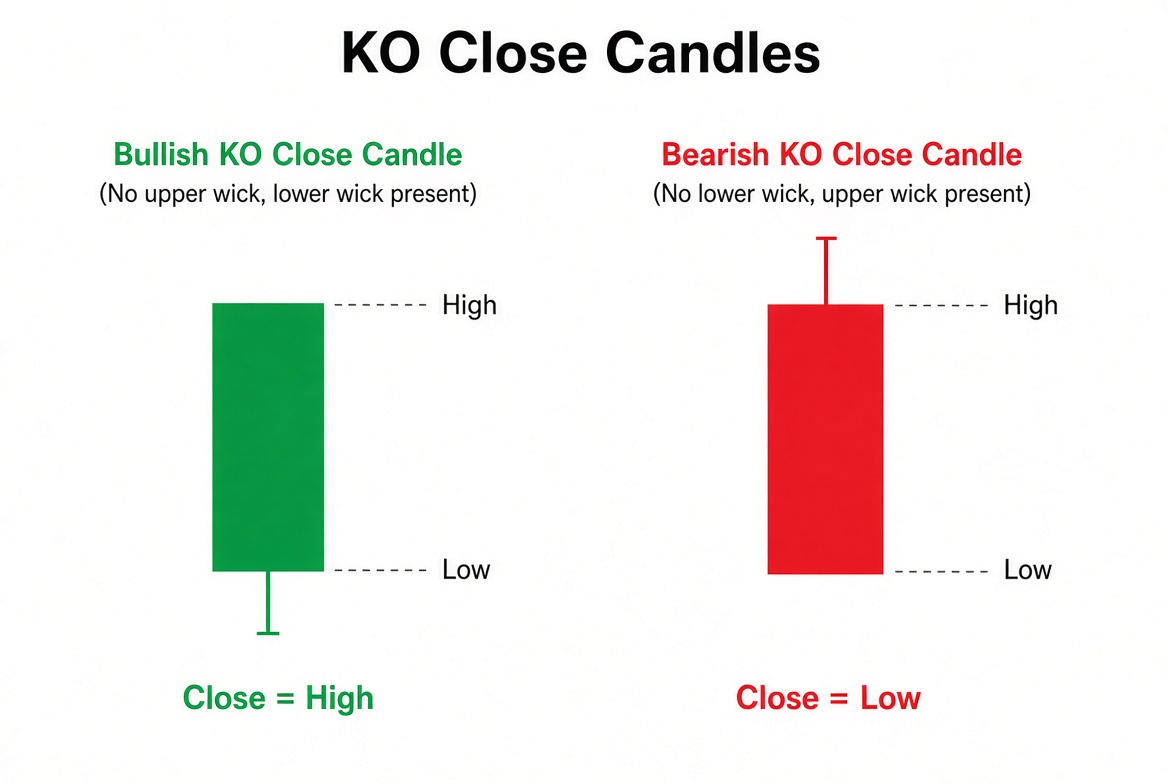
A Bullish Closing KO Candle always forms with the following characteristics:
- The candle closes bullish (Close > Open)
- There is no upper wick (Close = High)
- A lower wick is present
This structure shows that buyers maintained control right to the close of the period. The candle always reflects strong buying pressure at the close, regardless of its location in the trend or near key levels.
2. Bearish Closing KO Candle
A Bearish Closing KO Candle always forms with the following characteristics:
- The candle closes bearish (Close < Open)
- There is no lower wick (Close = Low)
- An upper wick is present
This structure shows that sellers maintained control right to the close of the period. The candle always reflects strong selling pressure at the close, regardless of its location in the trend or near key levels.
KO Candles in Different Market Contexts
While the structure and directional pressure of a KO Candle remain the same wherever it occurs, traders still consider the surrounding market context when making decisions.
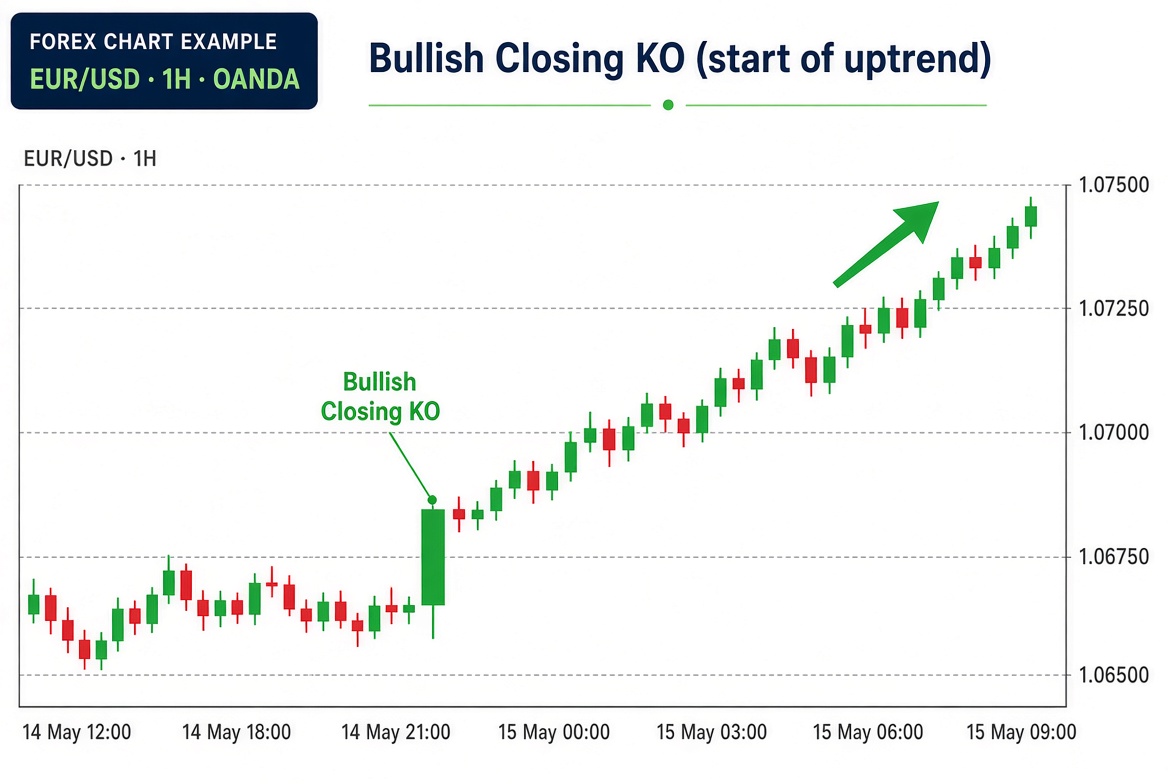
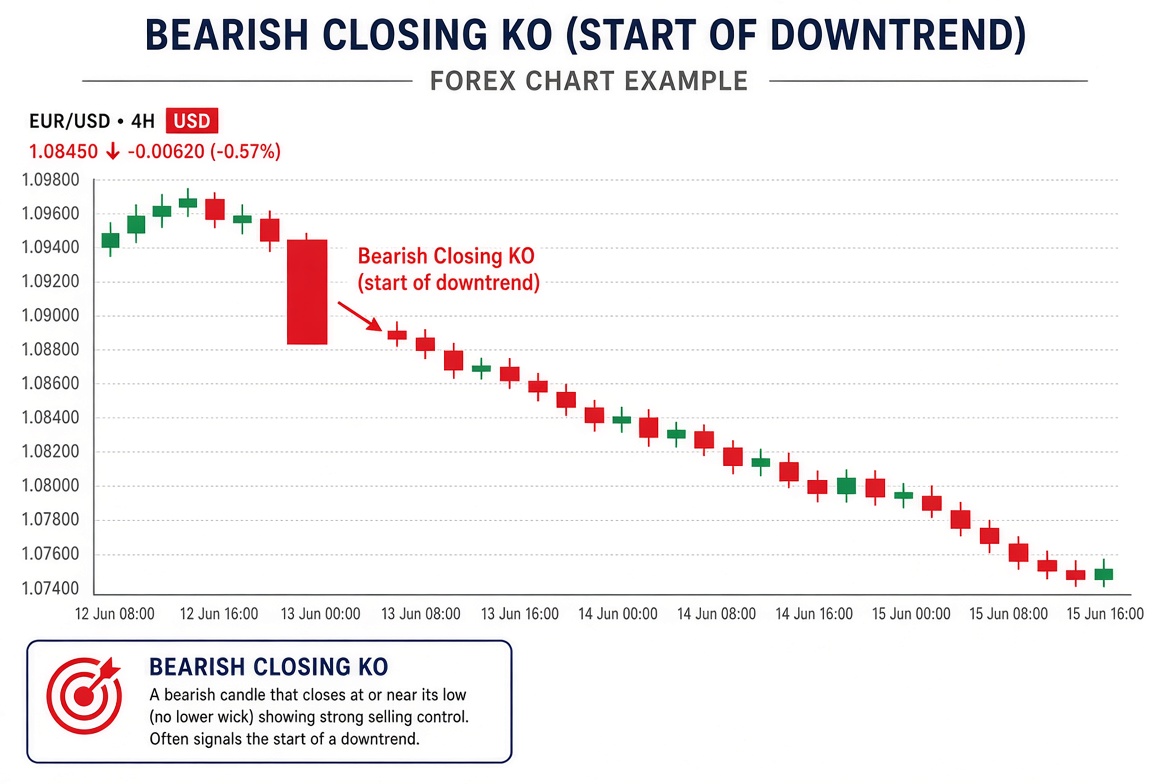
KO at the Beginning of a Trend
A Bullish Closing KO appearing as a trend begins often coincides with buyers taking control and strong upward momentum developing.
A Bearish Closing KO appearing as a trend begins often coincides with sellers taking control and strong downward momentum developing.
KO in the Middle of a Trend
A Bullish Closing KO forming inside an established uptrend continues to show that buyers remain in control into the close.
A Bearish Closing KO forming inside an established downtrend continues to show that sellers remain in control into the close.
KO at the End of a Trend
A Bullish Closing KO at the end of an extended uptrend still shows strong buying into the close, but the broader context may indicate possible exhaustion or the start of a retracement.
A Bearish Closing KO at the end of an extended downtrend still shows strong selling into the close, but the broader context may indicate possible exhaustion or the start of a retracement.
KO at Verified Zones
Verified zones include support, resistance, supply, demand, order blocks, and key Fibonacci levels.
A Bullish Closing KO near verified resistance or supply still closes at its high with no upper wick. In this location, traders often watch for whether price accepts the level or rejects it.
A Bearish Closing KO near verified support or demand still closes at its low with no lower wick. In this location, traders often watch for whether price accepts the level or rejects it.
Always combine KO Candle analysis with higher-timeframe structure, key levels, and proper risk management. No single candlestick pattern should be traded in isolation.
Key Takeaway
A Bullish Closing KO always has no upper wick and closes at its high. A Bearish Closing KO always has no lower wick and closes at its low. This structure and the directional pressure it represents stay the same wherever the candle forms. Traders use surrounding market context (trend position or key zones) to decide how to act on that consistent signal.
Educational content only. Not financial advice. Candlestick patterns do not guarantee future price direction or profits.